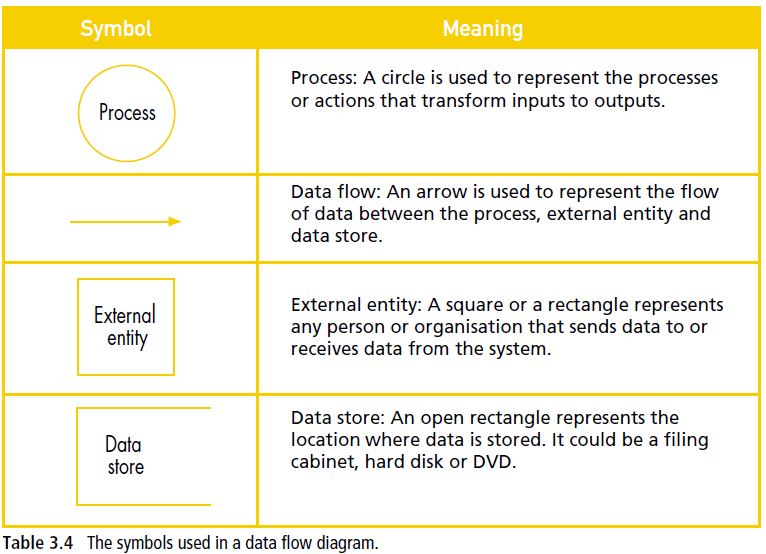
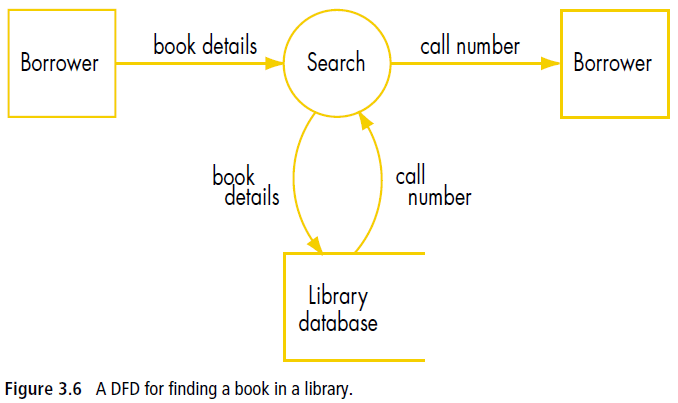
Data flow diagrams A data flow diagram (DFD) is a graphical method of representing a system using a number of processes together with inputs, outputs and storage. DFDs focus on the flow of data between information processes in a system. They show where data is collected, organised, analysed, stored, processed, transmitted and displayed. DFDs provide a simple technique for visualising the movement of data and describing what participants do, rather than what the computers do. There are four main symbols used in a DFD: the process, the data flow, the data store and the external entity (see Table 3.4).
It is often easy to start with a simple diagram and then add some more details. If the DFD becomes too complicated it should be broken down into a smaller DFDs to create different levels. The top-level DFD identifies the major processes while lower-level DFDs add more detail. DFDs and context diagrams are easy to understand as there are only three or four different symbols used. Participants can see the tasks that are completed by the information system. Context diagrams and DFDs often identify issues of responsibility before the system is designed. However, the simplicity of a DFD creates certain limitations. DFDs do not show the sequence of operations or decisions that are needed by a programmer. For this reason, they are often converted into system flow charts. |
11 IPT > 3. Developing Information Systems > 1. Traditional stages in developing a system > 3. Designing solutions >


